
Tools: Seed Oil Supply by Country Visualizer
The Very Elastic Supply Of Seed Oils

🌟🎅🎄Merry Christmas🎄🎅🌟
It’s been a while that I’ve coded up a little tool, but my friend Tyler Ransom has compiled this neat little dataset for “Seed Oil Supply” by country and year:
https://github.com/tyleransom/seed-oil-supply-by-country
This makes it really easy to just toss the data into what I was already using to visualize obesity (by country, by year) and change a handful of things to make it work.
So please check out the:
Seed Oil Supply by Country Visualizer

It’s relatively self-explanatory. You can select countries individually at the bottom, or select from a list of sets, e.g. countries people commonly find interesting, including America and Japan.
The x-axis is, of course, the year. The y-axis is “Food supply (kcal/capita/day).” So how many carolies each person in that country, on average, “is supplied with” each day.
We can see in the graph that U.S. supply of seed oils went from around 270kcal/day in 1961 to almost 715kcal/day today.
The average adult American surveyed in the NHANES survey eats an average of 2,155kcal/day.
That means the average American was eating 12.5% of kcals from seed oils in 1961, and 33.1% today. (Actually, total kcals eaten might’ve been different then, now that I think of it.)
Now these numbers need to be treated with a grain of salt, but it’s actually not that off from what I’ve seen estimated in other places by other methodologies. A common percentage for even 10 years ago was 20-25% of total kcals from seed oils. The stuff truly is in everything.
Let’s get to the grains of salt.
“Food Supply?”
First off, the dataset only shows seed oils that were “supplied” in the country. The issue is that we have no way of knowing what people ACTUALLY ate. It’s simply impossible to track.
People commonly use food frequency questionnaires, which are pretty unreliable. If I asked you how many times you ate chicken wings and salad w/ ranch dressing last year, what would you say? If I then estimated your total seed oils consumption based on it, would you feel pretty confident in my number?
This is a little bit like that. “Supplied” means that they collected data on farming, processing, and shipping of seed oils (or other foods). That doesn’t mean all of these were consumed. You could theoretically buy a lot of seed oils and pour them down the drain.
Not all the oil in deep fryers is consumed, a lot of it is thrown out. Some oil gets left in the pan or on the plate after cooking.
In addition, not all countries are great at reliably tracking these things. Looking at the dataset, I have the sneaky suspicion that a lot of poor countries barely track this. Of course, we’d also expect (most) poorer countries to actually eat less seed oils, as that’s historically been the case. So what’s the real effect? It’s difficult to disentangle.
But many of the trends make sense and confirm what every seed oiler is already talking about.
For example, let’s compare America to China, South Korea, and Vietnam:
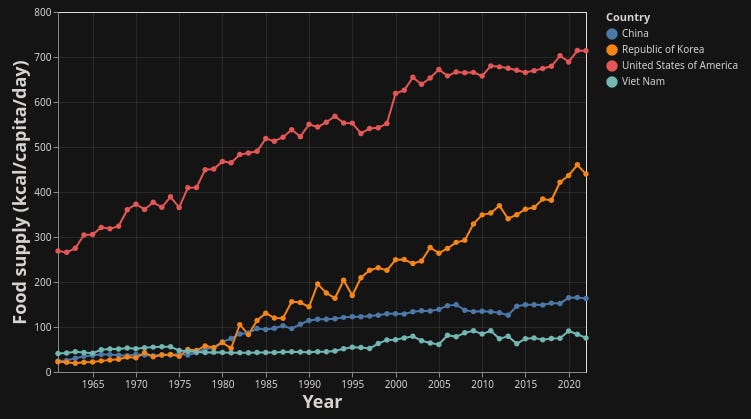
America has much higher seed oil supply than any of the other countries. In fact, America had more than double the supplied seed oils in 1961 than China does now, and 4x that of Vietnam now. Recall, Vietnam is the leanest country in the world.
You can also see that Korea started out even lower in seed oil supply than Vietnam in the 1961, but started rapidly increasing its supplies in the 1980s, to the point that it’s at more than half the U.S. amount today.
Anecdotally I can confirm this: when visiting Korea, I was shocked how many overweight & obese people of all ages I saw, and how few things I could eat. Their entire cuisine is very prone to being “infiltrated” by seed oils. They even cook their version of sushi (gimbap) in sesame oil. Unlike Japanese food and certain varieties of Chinese cuisine, their diet seems quite heavy in sauces too, which make it easy to hide seed oils.
South Korea has seen a pretty extreme rise in obesity since 1990. Unfortunately, we don’t have data from e.g. 1960, when the seed oil supply data set starts.
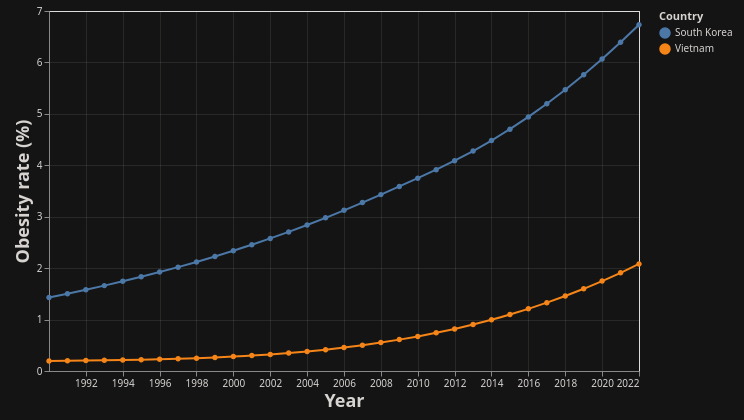
Frankly, after visiting Korea, I think that the 7% is an underestimate. Or at the very least, they’ll see a meteoric rise of obesity very soon.
We can also see that Vietnam’s obesity “exploded” from nearly 0% to about 2% in the same time frame. This makes sense given that even Vietnam’s supply of seed oils has more than doubled since 1961, even if it’s still extremely low in both seed oils supply & obesity.
“Harmonized?”
The data comes from the U.S. Food and Agriculture Organization. They changed their method for collecting or listing data around 2014, and if you look at the raw data, there are huge discrepancies in the before compared to the after.
This “harmonized” data set is an attempt to reconcile the two by seeing how they diverge during the period when both methods overlapped (2010-2013) and then calculating a comparison factor for each country. All this is explained in more detail at Tyler’s data repo.
This method isn’t perfect. For example, Canada is listed as having substantial negative seed oils supply for decades. Now I suppose it’s possible that Canada purchased U.S. soybean oil in the 1960s and dumped it all down the drain, but I’d suspect probably not. It’s probably just an artifact of the harmonization formula.
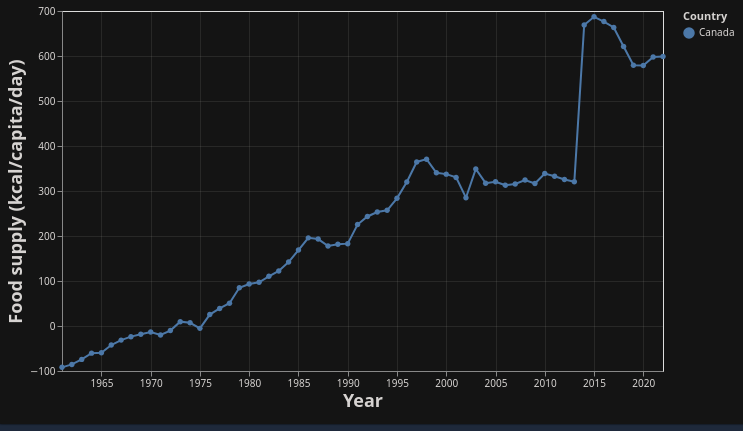
Canada’s “harmonized” data both starts at -100kcal/day of seed oil supply, and also displays an insane jump around the time of the method shift (~2014), meaning the harmonization didn’t work very well. It more than doubled in one year just due to the shift in methodology.
Seed Oils vs. Linoleic Acid
Lastly, not all seed oils are created equal. Most believers of Modern PUFA Theory (MPT) believe that linoleic acid (LA) is the bad actor in seed oils.
Soybean oil has about 50% LA, corn oil 55%. These are some the most widely used seed oils in the U.S. In contrast, much of Asia uses palm oil (~10%), sunflower oil (~20%) or rapeseed oil (~20%).
In that regard, sesame oil is actually much worse: it has about 40% LA, nearly as bad as soybean oil. But sesame oil seems to have a bit more of a rare/high culinary status compared to the others.
So even if e.g. Korea and the U.S. used the exact same amount of seed oils, but the U.S. used soy & corn vs. Korea’s sunflower and some sesame, we’d expect way more damage done in the U.S.
Conclusion: Grain of Salt, but kind of useful
Given all these, I wouldn’t get married to any conclusions or hypotheses merely based on this dataset or visualizer. But I think it’s still quite useful:
You can roughly compare several countries, although you have to be aware that the trends might be off by quite a bit
You can see the trend (=rise) of seed oils of a single country over time
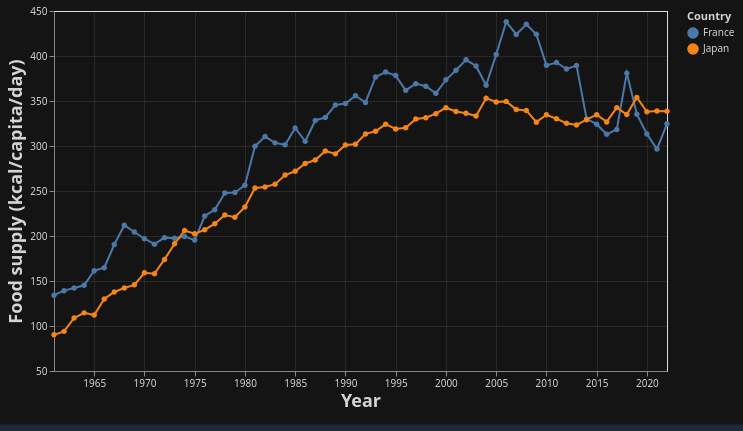
You can see that the rise of seed oils happens in almost every country over time, although some seem to have stopped (Japan) and a handful even reversed it (France) - interestingly, France is also one of the few countries that have started reversing their obesity trend!
You can gut-check the people claiming “Asians eat so much seed oils!” - yes, they eat more than ever, and they’re more sick & obese than ever. But for most Asian countries, it’s a fraction of the seed oil supply in the U.S. and many other western countries.
"much of Asia uses palm oil (~10%), sunflower oil (~20%) or rapeseed oil (~20%)"
Sunflower oil has one of the highest LA content, not 20%. It's between 60-70% based on what source you check.
Interesting how Denmark seems to have tanked in consumption, yet I see more obesity than ever and Denmark being Denmark is super duper into the whole diet heart hypothesis, which means they demonize saturated fats as much as possible and also have real high costs on animal products in general, because animal bad, plant good — except pork I suppose, but we all know the fat in pork is bad.