
Visualizer: Obesity by Country
A quick little tool to visualize changes in obesity rates over time

The other day I randomly thought about obesity, as is my habit. I remembered that Vietnam had been the country with the lowest obesity back when I wrote a post visualizing obesity vs. diabetes.
I wondered… has it always been the leanest country? And even if so, how has its obesity rate changed? Almost all countries in the world have seen drastic increases in obesity. What about Vietnam?
I went to Our World in Data about obesity and downloaded their obesity rate data set. It contains pretty much any country you can think of, and has obesity rates from 1990-2022.
Since I already had a bunch of graphs & visualizers online, it was simple enough to add another page to my Macro Calculator and I can proudly present to you: Obesity by Country.
So let’s take a look at Vietnam:
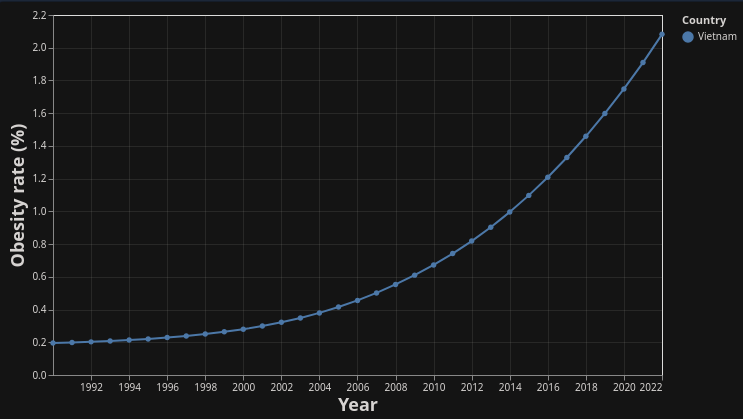
Oh, my! Vietnam’s obesity rate has actually exploded in the last 30 years. It went from below 0.2% in 1990 to over 2% in 2022, for an increase of over 10x. This is similar to what the U.S. experienced around 1900 or so, maybe even before that around the time of the Civil War.
Makes you wonder, are there other countries that started extremely low and experienced rapid growth in obesity rates?
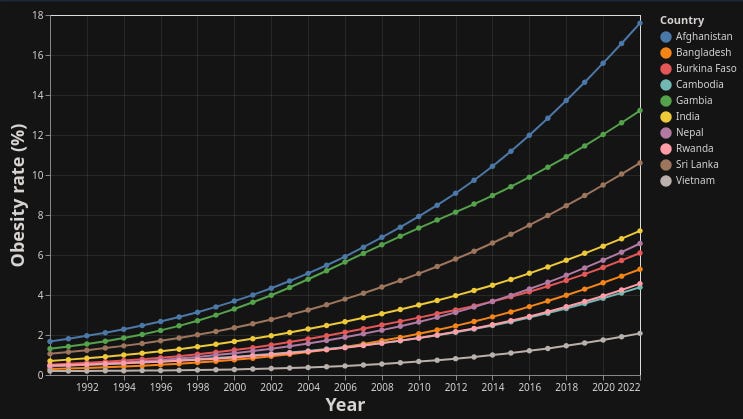
Easy enough to find out! I added a preset button for the 10 countries with the highest (relative) growth in obesity rates. Afghanistan went from <2% to nearly 18%.
What if we compare the most obese with the least obese country?
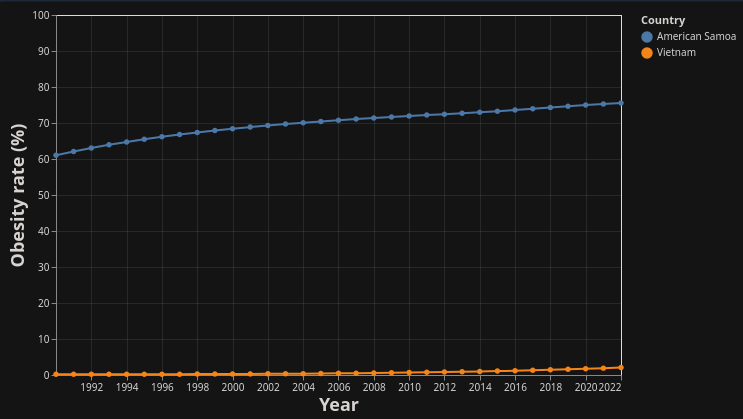
Dear Lord! American Samoa had an obesity rate of over 60% in 1990, and it’s at 75.5% now.
Meanwhile, Vietnam is scraping around the bottom as it went from 0.2% to 2% in the same time.
What are the 10 most obese countries?
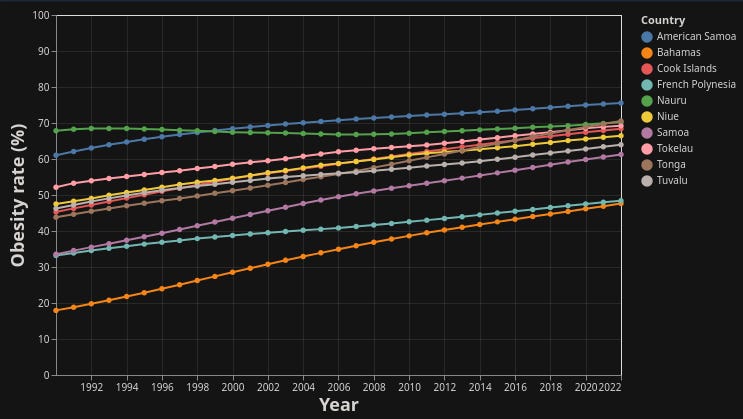
Wow, turns out the U.S. doesn’t even make the list, although it’s close at 42% versus the Bahamas’ 47%.
I’ve added a bunch of “presets” to explore interesting topics like this. Below that, you can select/deselect every individual country if you so please.
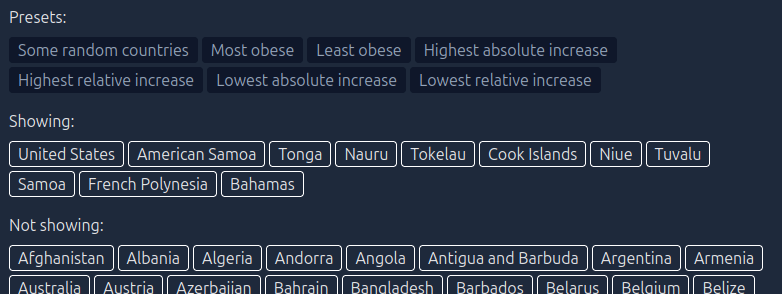
There’s also a checkbox to switch between a fixed scale of 0-100% vs. a dynamic scale. The fixed scale is nice to visually see how lean the lean countries are vs. the obese countries.
Meanwhile the dynamic scale makes it easier to see the differences between several lean countries, or to see their rate of change over time better.
For example, let’s say we want to study Vietnam and Japan, two famously lean countries:
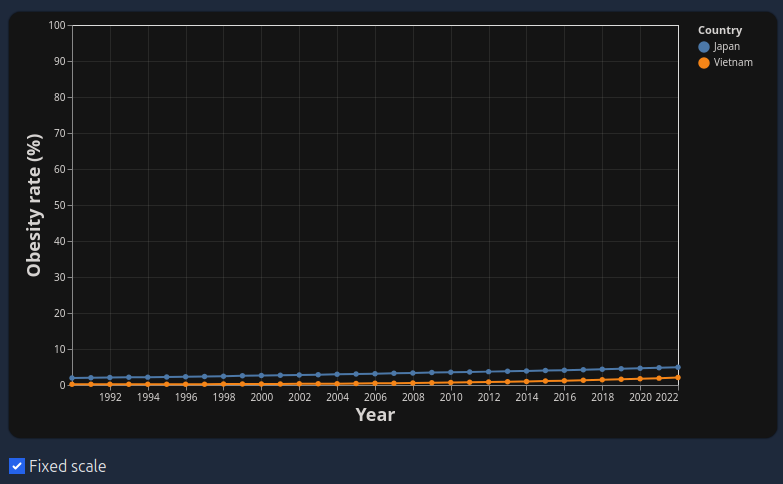
Wow! Both Japan and Vietnam are incredibly lean. On the fixed 0-100% scale, they both score so low they’re barely getting off the bottom axis.
That’s great for seeing just how lean they are in the grand scale of things. But how do they compare against each other, and how much did their obesity rise?
The dynamic scale makes this much easier to see:
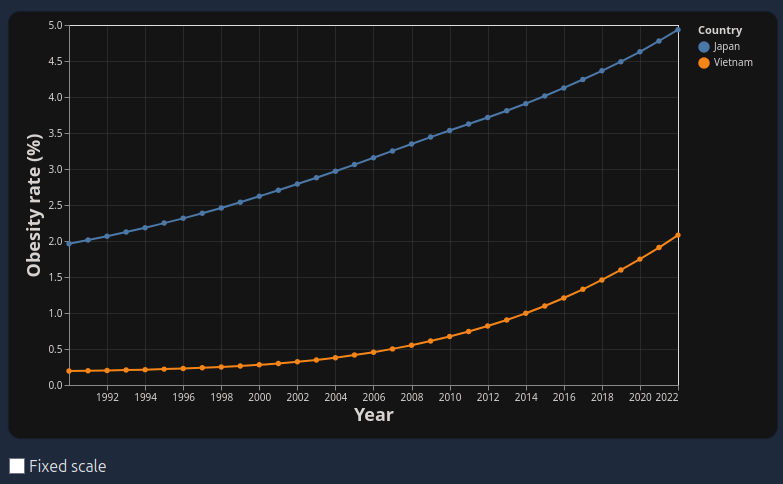
Ouch! While both countries are very lean, Japan was actually 10x more obese than Vietnam in 1990, roughly the level that Vietnam is now.
But Japan has only gone from those 2% up to 5% in 2022 - whereas Vietnam has grown at a much faster rate. Both countries have experienced incredible rises in obesity, even if they are still extremely lean compared to the U.S. or American Samoa.
Well, this was just a little project that I got into my mind last night instead of falling asleep lol. Adding the data was trivial, and I’m pretty happy with the presets and how the whole thing turned out.
Hope you enjoy playing around with your favorite countries! Let me know if you find anything interesting, or if there are curious findings like Vietnam’s incredible rise in obesity that would make an interesting preset.
Sir, you are AWESOME.
Looking at my country (Canada) I see a flattening of the curve since 2010. I am also surprised to see the US having so much more obesity and the curve flattened less... We eat pretty much the same foods. Is it because health care systems are so different? We burn more energy in Canada because of the cold? (ha) Call me curious...
Just keep on traditional foods.......like imported soy oil etc.