
ExFatloss 2024: Year in Review
What I did this year, and what I've got planned for 2025

Summary of the various things I had going on with this blog & project in 2024:
My personal progress in terms of weight loss & related
Experiments I ran on myself
Posts I wrote
Web tools I released
What I had planned but failed to do
ExFatloss plans going forward

Personal progress
Weight
Here’s my weight for the entirety of 2024:

You can see I started and ended the year around 230lbs. But from January to April I got down to 217lbs, where I stayed for several weeks.
I spent most of April to October around 220-225lbs, with a brief excursion down to 210lbs via a 5-day fast.
In October, I did the rice diet experiment and retained a lot of the weight gained on the previous protein refeed, or maybe I gained it on the rice diet itself, hard to say.
So the year was a wash in terms of weight, but I did spend most of it at the lowest weight I’ve been in about 7 years.
Confusingly, I broke through the 220lbs and achieved my lowest weight for the entire year on ex150-9, doing the same old ex150 I’ve been on for most of 2 years now. I couldn’t tell you what was different this time.
Non-24 circadian rhythm disorder - fixed?
Did I beat it? Non-24, a circadian rhythm disorder, has been the bane of my existence since I was a small child. Some of my earliest memories are about it.
It’s the reason I’ve been doing pretty strict keto for the last 9 years. 2 years ago I attempted the potato diet and the Non-24 promptly came back, ruining my sleep cycle.
Yet this year, after avoiding seed oils on ex150 for ~2 years, I could do a full month of a rice diet without any sign of my Non-24.
This is super huge for me. I think. I actually don’t really care for carbs any more, I suppose 9 years of keto will do that to you. After the rice diet, I was glad to be back on heavy cream. Feels & tastes better.
Still, it is somewhat miraculous. The cause of Non-24 in non-blind people is unknown, and there is no known cure. First, I put it into remission with keto for nearly a decade. Now, apparently, it’s just gone completely, and I can presumably eat carbs again if I want to.
I just - currently - don’t want to.
Did 12 OmegaQuant Complete tests
I did an OmegaQuant Complete every month. I’m up to 15 in total now. Yes they’re $100 each. Although I stocked up on Black Friday, lol.

Honestly there isn’t that much of a change, except for the very last one - taken at the end of the rice diet.
I’ll have an entire post on that coming up soon, as I think it gives some pretty good insights into the intricacies of the OmegaQuant. Obviously it would be easier if we could just test adipose tissue fatty acids, but I haven’t found a way to get that done.
Ran 16 experiments
ex150-12 (current)
Measured my Carolies
I suspect I might have a better and more objective impression of my carolies than 99% of people alive. I did several RMR (resting metabolic rate) tests and 2 tests of my TEE (total energy expenditure) via DLW (doubly-labeled water).
The objective answer: I burn 2,938kcal, or 4,645kcal, or 2,859kcal, or 3,531kcal/day.
In short: it’s impossible to measure CICO even with the “gold standard” $1,000 method of Doubly-Labeled Water, and the DLW result is incompatible with the “weight/calories in” titration method as well.
I should’ve lost tons of weight during the first DLW trial but didn’t, and I should’ve gained during the second one but didn’t.
CICO is beyond useless.
Wrote 47 posts in 2024
Oh my! Apparently, I’m up to 122 posts. Some are shorter, like the posts announcing a new web tool. Some are 10,000 word behemoths, like my Grand Theory of Circadian Rhythm & Jet Lag.
Can you tell I enjoy typing?
Released 2 or 4 web tools in 2024
You could either say 2 tools, or 4 tools, depending on how you count. The last 3 are sort of related and part of the same URL, so they’re not exactly independent tools - more different parts of the same overall project.
Omega Tracker
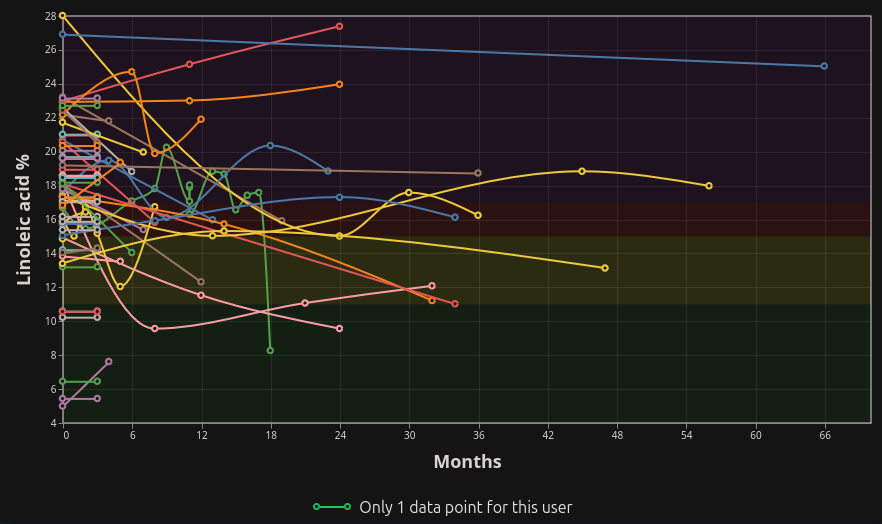
The Omega Tracker came about from a visualization that Reddit user OneSmallHumanBean would generate each time one of us reported a new OmegaQuant Complete result.
The number we were most interested on that report is the linoleic acid %, because we think that this omega-6 PUFA is the “bad guy” when it comes to metabolic dysfunction. The OmegaQuant could be a proxy for adipose levels of this fatty acid, but it doesn’t map 1:1 and we have to find out the strengths & weaknesses of the OmegaQuant as a proxy, which this tool helps us do.
Eventually, this database turned out to be a great candidate to just make a small web tool for so it would be easier to generate & keep track of.
This is perhaps my favorite tool released this year, because it grows with the number of data points reported by others.
We now have 127 linoleic acid numbers in the database. The highest is 28%, the lowest 4.97%. The vast majority are from 15-23%.
Most people who’ve been avoiding PUFAs very seriously, for a long time (several years or more) are below 13%.
Learn more about my interpretation of the results: What can we learn from 100+ OmegaQuants?
TEE & Macro calculator
The idea for this tool came about after reading Herman Pontzer’s book Burn (review here) and arguing with CICOpaths and protein bros online.
If CICO fails, CICOpaths will always tell you that you need to eat less/work out more.
If “prioritizing protein” doesn’t work, protein bros will always tell you that you need to eat even more, or combine it with CICO.
Some of these people were spitting bizarre numbers, and had clearly not done the math on their own macros. They would say things like “You need to eat 30% of your calories from protein” or that “nobody needs more than 2,000kcal.”
Both of these statements are nonsense unless we’re talking about extreme edge cases. And it’s actually the same edge case: starvation diets.
Yes, if you only eat a small amount of total energy, you can probably tolerate 30% of it coming from protein. But this becomes more and more difficult as you approach a normal adult TEE.
The reason people can live in this weird, seemingly contradictory world is that they think a TEE of 2,000kcal/day is normal for an active, adult male.
This is clearly false. That’s why I appreciated Pontzer’s work: he actually went out into the field and tested the TEEs of thousands of people living in the real world, from sedentary Americans to hunter-gatherer tribes in Africa.
It turns out that 2,000kcal/day would be the expected TEE of an extremely small woman, or, more likely, a small child.
I wanted to have a calculator that showed you the relationship between lean mass, TEE, and suggested protein intake levels visually.

And instead of the typical “enter your TEE here” and “set your protein% there", which leads people to type in “2,000” and select “30%,” I wanted the values to be realistic, based on real-world data and recommendations.
So I only let you enter your lean body mass, and show the expected cone of TEEs. You can then select your metabolic adjustment up or down a bit, because those variations do exist in the data. But there’s no way in hell the average adult male burns only 2,000kcal/day unless something is significantly wrong.
At the same time, you can select actual protein recommendations, and it shows you how low a percentage those actually are. It depends a bit on your lean body mass, but the RDA for my lean mass (~150lbs) is only 8%, and the “highest level of protein at which anyone found any benefit, ever” of 0.82g/lb, is still less than 20%.
Hence, even 11% constitutes a “high-protein” diet. 30% would be bizarre.
Hopefully, this calculator will help people visualize & connect the dots here: metabolic rate is generally vastly underestimated by fitness people compared to the real-world data measured, and protein intakes recommended vastly too high.
Try out the TEE & Macro calculator
Adipose Flux calculator

This little calculator estimates your total energy flow from your adipose tissue, and what % of that is linoleic acid.
That can give you an estimate of how much you’re “PUFAing” yourself every day, via the PUFAs you’ve stored in your own body fat.
Try out the Adipose Flux calculator
PUFA depletion calculator

This one is similar to the last one. The difference is that it estimates how long it will take to un-PUFA yourself. Based on your (estimated) starting adipose linoleic acid content and your dietary intake.
Assumptions are a steady rate of lipolysis of 32kcal/lb of fat/day, and that 1% of LA will be used for structural purposes, e.g. to build into cell phospholipids. This will be the “essential fatty acid” component.
The floor will be your intake level, because you can never drop below that.
The calculator will then draw a graph that looks something like the above: you’ll lose a lot of linoleic at first, with the rate of depletion slowing over time until you gently glide into the mathematical floor of your intake %.
What this graph suggests is that most of the change will come very early on, in the first 2 years or so. After that, any progress will likely be incremental and slow.
In the example pictured, you’d drop from 25% linoleic acid to 13% in just a year, to 8-9% in 2 years, and make it to 5% in 4 years. To get from 5% down to 2.5%, the value found in modern grain-fed beef and dairy, would take you another 4 years.
Would you notice much of a difference in years 4-8? Maybe, maybe not. There are some anecdotes of e.g. joint pain improving over time.
But the majority of the benefits should come very early on, in years 1 and 2.
Try out the PUFA depletion calculator
Swamp visualizer

This one’s a lot of fun. I had long thought about expanding on Denise Minger’s idea of the metabolic swamp as I was talking with members of r/SaturatedFat.
Besides not mixing fat & carbs to lose weight, many people there (including myself) seemed to benefit from restricting protein as well.
Was protein part of the swamp?
If so, the swamp would have to be a triangle. One Lazy Sunday Afternoon I sat down and tried drawing the metabolic swamp:

Behold my MS Paint skills! Almost immediately, though, a static picture proved to be useless. It was nigh-impossible to move anything around, since every line had to be redrawn or re-arranged. I could scarcely display more than 1 or 2 ideas at once without the whole picture becoming noisy and unreadable.
So I went and made it another visualizer web tool instead. Even without the interactive parts this allows, it makes it much easier to change things up.
For example, someone suggested recently that a 30% fat diet wasn’t really a low-fat diet by the standards of anyone actually attempting to do low-fat. On the other hand, low-carb diets are often defined as being 30% carbs or less. Now you could argue if these SHOULD be symmetrical, but in practice, they’re often not.
It took me 2 minutes to change this and make low-fat only go up to 20% fat. In the hand-drawn picture, I would’ve had to rearrange most of the lines manually.
In addition, it’s quite easy for me to add traditional & modern diets and place them in the swamp. Instead of hand-drawing them in and clobbering the picture, it’s trivial to add a new button and have the program do all the work for me. That means we can now visualize the following diets:
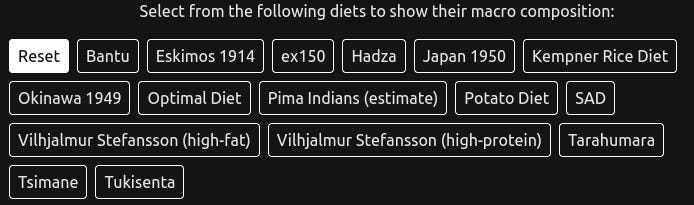
Putting them all on our triangular map:
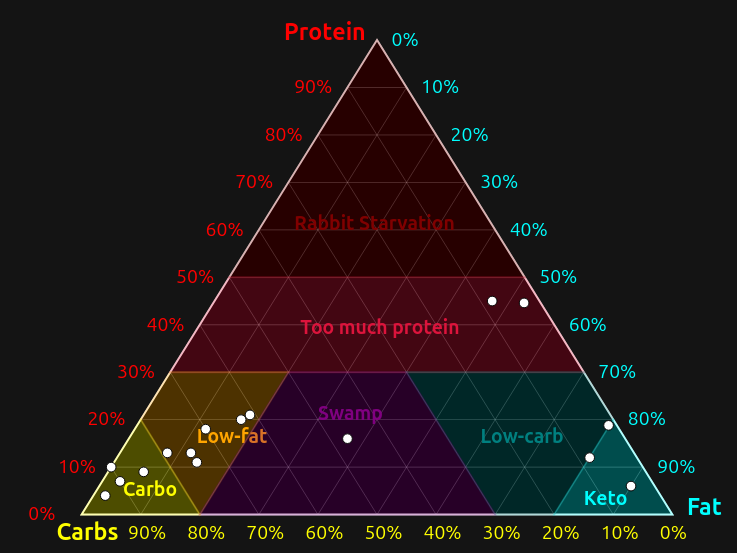
It appears that most historic diets were low-fat or even carbo. The handful of exceptions are modern keto & variants, the eskimos’ & Stefansson’s carnivore diet in the early 1900s, and the Standard American Diet smack in the middle of the swamp.
If you find any more studies of interest with exact macro composition (carbs/protein/fat), please send them my way. This could be historic/ancestral populations, or maybe an interesting internet diet.
Failures
Didn’t reach my goal weight of <200lbs
I had a personal goal of hitting 200lbs. That’s an easy goal to set when you drop 20lbs in the Spring and hit a new record low of 217lbs by March, lol.
Unfortunately, the metabolism works in mysterious ways.
Of course I could just fast my way down to touch 200lbs. But I’d probably have to restrict carolies permanently, or outright fast a lot, to stay down there.
And this sort of temporary put-it-on-your-credit-card weight loss isn’t particularly interesting. I’m trying to fix my metabolism. Normalizing body composition is just a byproduct of that.
So “200lbs” is probably not a good goal; it’s not actionable. Finding out how to fix the metabolism is the entire project here at ExFatloss. If we knew how to do it (besides just starving our way down on our credit card), I wouldn’t need to be doing any experiments or writing a blog, and we wouldn’t have an obesity epidemic.
Didn’t run a Trial in 2024
If you weren’t around then, I ran a Cream Diet Trial with 10 participants in 2023.
We laughed, we cried, we lost 9.6lbs in 30 days (on average).
It was great, but it was very time intensive. I wanted to run another trial in 2024, maybe cream diet vs. potato diet or something of that nature. A real RCT!
Unfortunately, the effort of running these is so high that I had wanted to create a web tool to help: something for the participants to log in, save their daily weigh ins, maybe add comments, answer common questions..
But I haven’t yet made such a web tool. For one, it’s a bit more effort than the simple visualizers and calculators I’ve made so far.
Second, I (thought I?) was unable to do a HCLFLP trial like a potato diet myself, due to the Non-24/keto issue. I think I was subconsciously uncomfortable putting people on a diet I hadn’t tried myself. Now that I’ve completed a month of rice diet and it was quite tolerable, I think I’m much more comfortable with the idea.
Still, building such a trial tool is a bit of a lift, not a short weekend project like the swamp visualizer. So it’ll take me some time.
But I really do want to run at least one trial in 2025.
ExFatloss Goals Going Forward
Less about me
I’m sure all of you are dying to read about my weight all the time, lol. But at the very least, it’s a slow process now. Gone are the days of 20lbs lost in one month!
As I’m nearing my optimal weight, whatever that is exactly, losses seem much slower. I might have to wait quite a while for my adipose levels of linoleic acid to drop. Or something else, who knows.
Or maybe I’m just at the end of the line, and 220-230lbs is as low as I can go without starving myself.
If so, that’s fine. I’m wearing size L shirts, size 36-38 pants, I can go on spontaneous 5 mile walks and run up stairs and almost do a handstand push-up. I feel amazing, better than I ever have as an adult.
If we could get more people to effortlessly reverse morbid obesity, lose 70-75lbs, and massively upgrade their quality of life, that would be awesome.
But my own experiments are becoming more and more niche/technical and less and less interesting.
I’m also, frankly, out of ideas to experiment with: doing HCLFLP (like the rice diet) was the last big one I had. I might try dry fasting for a few days, or a variant on HCLFLP. Potatoes again? Sugar instead of rice? Honey diet?
Reducing the cost of n=small experiments
Instead, I want to enable others to experiment more. A large part of that is sharing information, anecdotes, and ideas, like we do here on the blog, on Twitter, and on r/SaturatedFat.
Additionally, I’m hoping that the web tools I’m building help people illuminate or understand some of the hypothesis out there better, like swamping with the Swamp Visualizer, or depleting their linoleic acid with the Omega Tracker or PUFA depletion calculator.
I believe the Omega Tracker in conjunction with the $100 OmegaQuant Complete test allows people to get a pretty decent picture of where they are in their PUFA depletion journey.
Allowing people to do n=small trials more easily with a custom web tool would take this a step further.
The end goal of ExFatloss is to reverse obesity by fixing metabolic dysfunction. The closer we can hone in on a solution for as many people as possible, the better. And at this point, we’re still much more in the experimentation than implementation phase.
Eating cream is cool, but I personally know of people out there doing tallow, raw beef trimmings, honey diets, dry fasting, Emergence Diet, HCLFLP, fruitarianism, milk only diets, and much more.
It’d be even cooler if we could quantify & validate all those, see what works and for whom in which circumstances.
Thank You!
While all this might’ve been possible without you, the reader, it wouldn’t have been nearly as much fun. I learn a ton from talking to people, reading people’s n=1 experiments in the comments and on r/SaturatedFat, and bouncing ideas off each other.
I want to thank everyone reading along here, both if you’re active in the comments or silently lurking in the shadows. Also everyone on the fantastic r/SaturatedFat subreddit, and everybody shitposting with me on Twitter or whatever he calls it now.
Finally, thank you to John and Tyler and David and Leo and Eli and Tucker and Matt and F and K and G and M and SM TM and anyone else I’m forgetting.
If you want another idea to experiment with, are you aware of Grant Genereux's belief that Vitamin A toxicity is one of the major causes of the diseases of civilization? He and some others have lost weight on a low-Vitamin-A diet (which he originally undertook to cure his eczema). He writes:
"When I first started on my vitamin A elimination diet one of the very unexpected side-effects was the effortless weight loss. My experience was not a one-off either. I had a (non-diseased) colleague report the same result. Even though we had vastly simplified our diets, it was still providing ample calories (3,000 or more) and all the required nutritional elements. Although n=2 in this study, for two men in their late fifties, to quickly drop around 30 pounds each, and without trying at all to do so, that result was quite intriguing. There was indeed something very unexpected going on here. It’s especially so considering that we’ve both effortlessly kept that weight off for three years now too."
There's a lot more on his website https://ggenereux.blog , including some free e-books describing his theories in detail, and a blog that's not unlike yours.
Looking forward to seeing what you cook up in 2025 ~ !! Happy New year ~